Playbooks
Being the owner of your own business means you have to make a whole lot of decisions—big and small, in and out of your expertise, and in lightening speed. That’s why we created Playbooks, a shortcut to finding the information you need to get the job done.
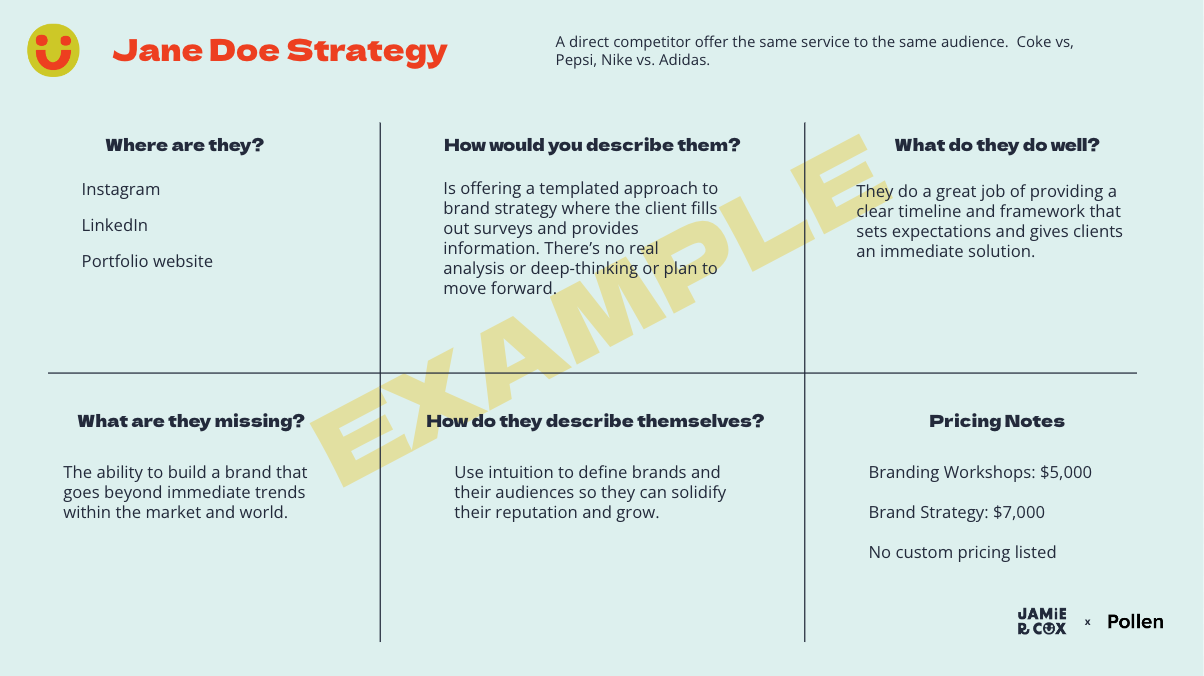
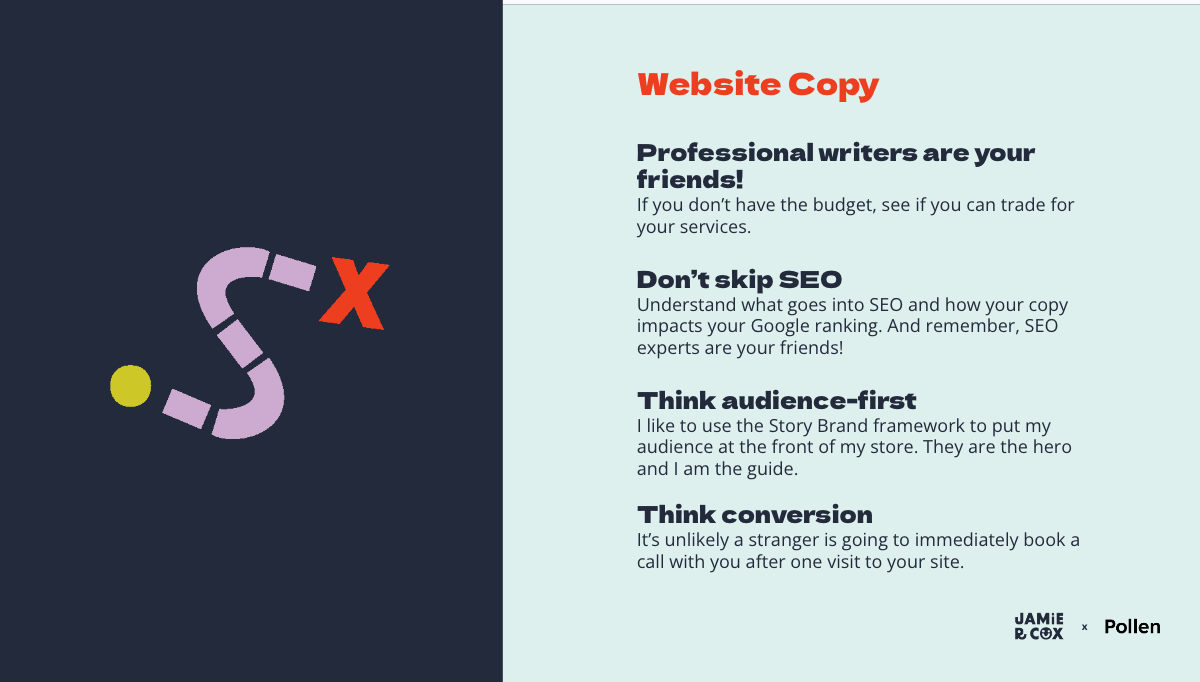
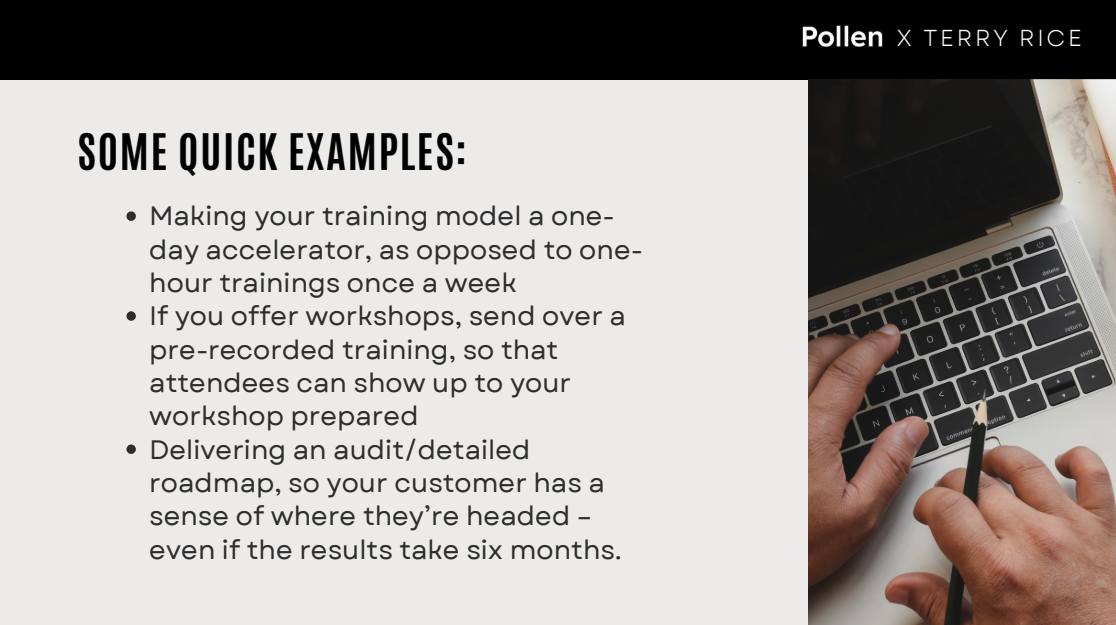
A Playbook is a tactical walk-through to solve your most pressing business challenge. Whether you’re updating your marketing website or building up your referral growth loop, Playbooks give you a digestible ‘how-to’ think about your business challenge and action it.
A Playbook is a tactical walk-through to solve your most pressing business challenge. Whether you’re updating your marketing website or building up your referral growth loop, Playbooks give you a digestible ‘how-to’ think about your business challenge and action it.

Get step-by-step guidance to solve your most acute problems

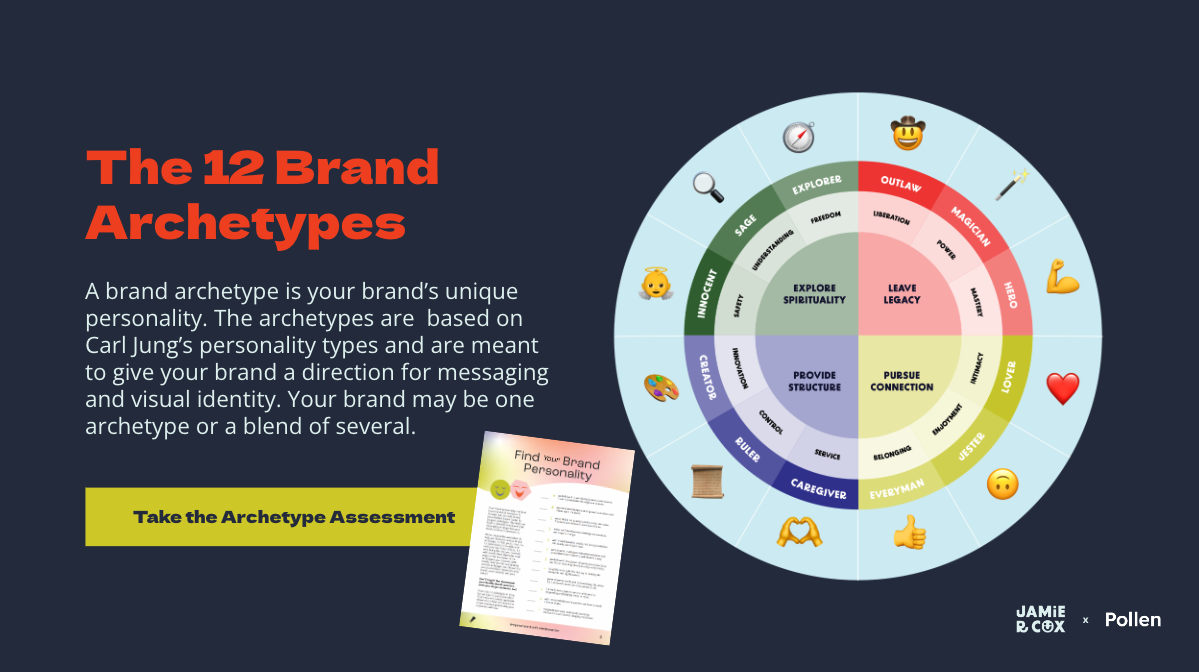
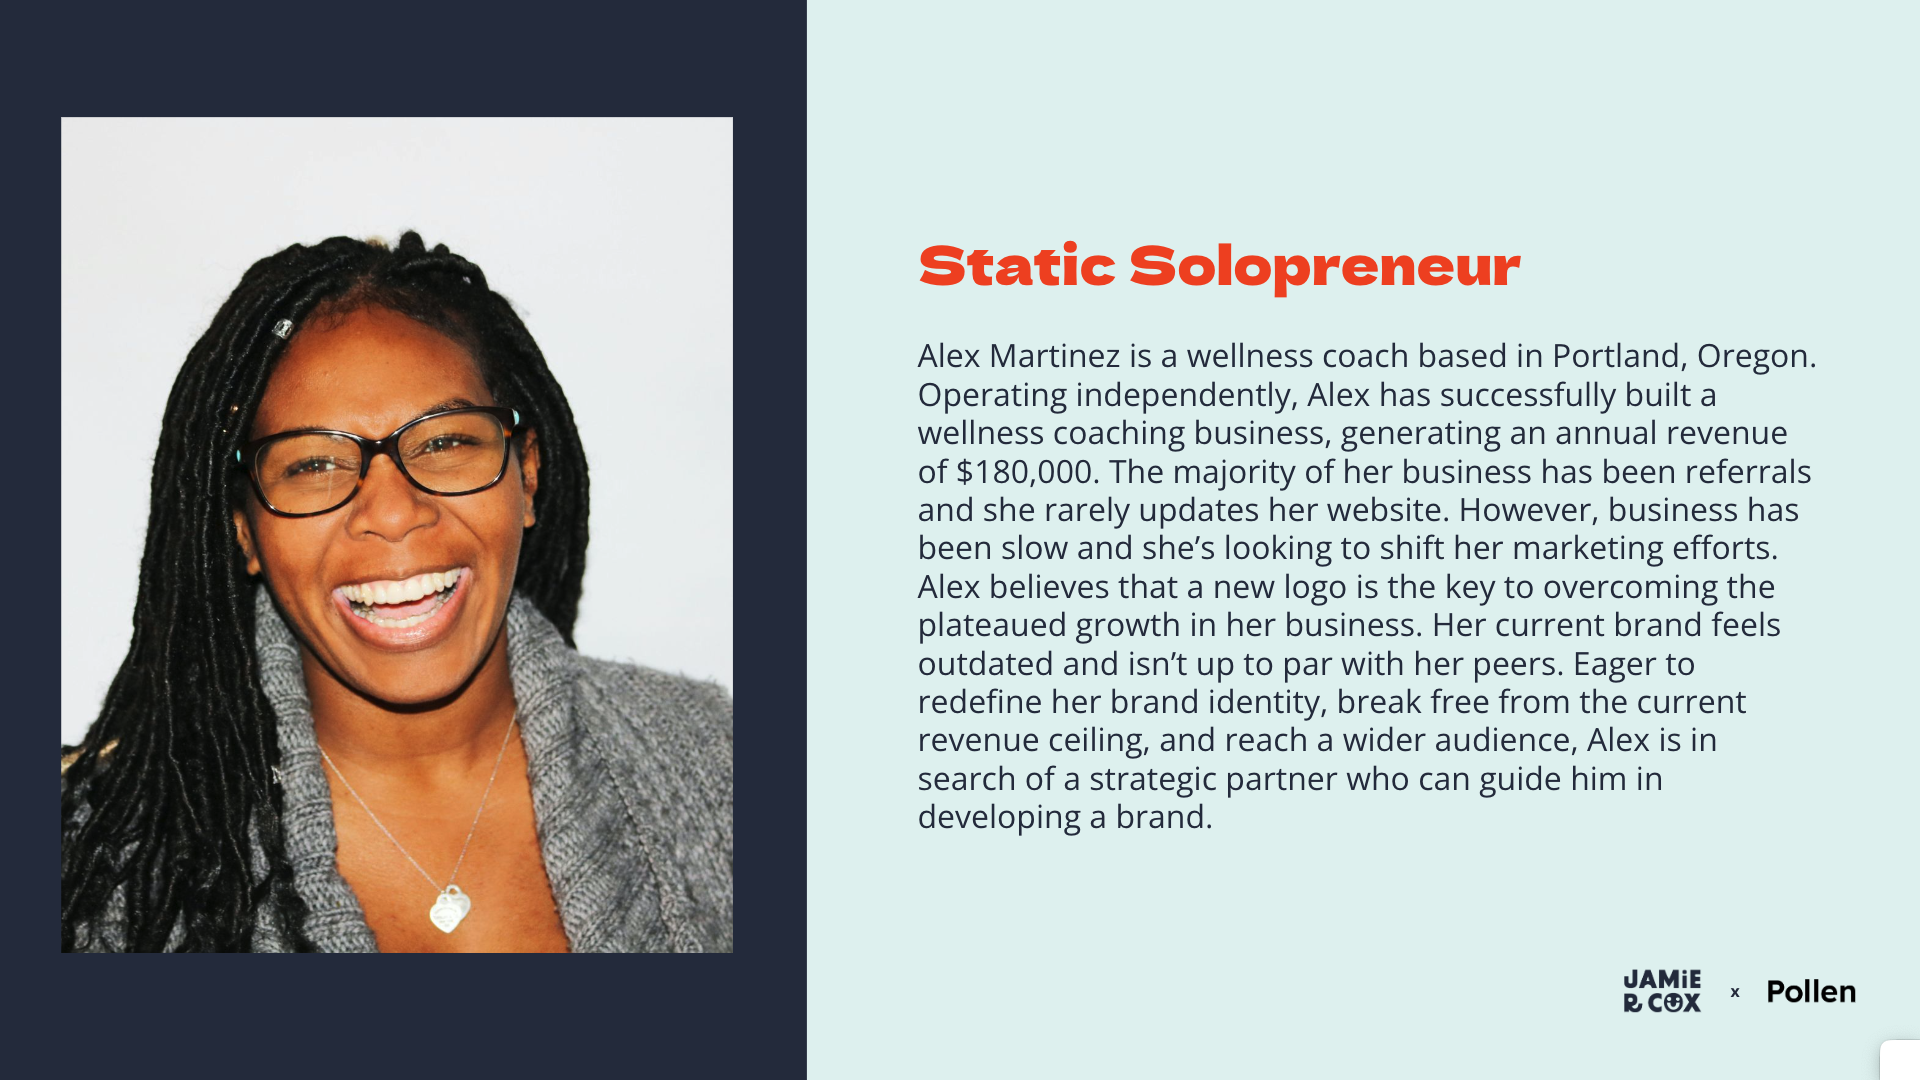
Learn actionable tactics and frameworks

Get the resource you need on your own time

Written by industry experts
Tactical walk-throughs to solve
your most pressing business challenge
your most pressing business challenge
.png)
Browse
Playbooks
Playbooks
Get step-by-step instructions to navigate your challenge, so you can easily move into action — and gain the confidence of knowing you’re learning from those who have done it before.

Playbook
Authors
Authors
Playbooks are created by seasoned business owners, lawyers, and coaches. They’ve been in your shoes, navigated the unknown, and are sending the ladder back down.
Our experts are highly vetted and hand selected based on substance, not social, so you know you’re getting the good stuff.

Austin Church
Pricing & Growth Expert
.png)
Nacondra Moran
Finance & Accounting Expert
.png)
Jennifer Becker
Legal Expert
For over a decade, Jen has helped her clients get their contracts and business dealings dialed-in so they can get back to their craft.
EXPLORE ALL FEATURES
Weekly events
Prioritize real progress with multi-week sprints, single-session workshops, and connect with fellow members.
Vetted Community
.png)
This is what they mean when they say “find your people.” Pollen’s community of experts who know what it takes to go solo—all the triumphs and self-belief it requires—and they’re in it with you.
Pollen membership pricing
Unlock the full power of a Pollen membership to take your
independent consulting business to the next level.
independent consulting business to the next level.
Your Pollen membership includes unlimited access to
Sprints, events, and live workshops
Vetted community of peers and experts
Premium resources and tools
Have questions?
Book a call with a member of our team
.svg)

